
Empirical Benchmark · n = 2,488 · Scored 21 Feb – 19 Mar 2026 | 8 min read
Founders describe the problem well and the business model badly.
That is the finding, and the gap is larger than anyone in the market talks about. Across 2,488 pitch decks, the section describing what is broken in the world scored a median of 12 out of 20. The section describing how the company makes money scored 6.
Same documents. Same authors. Same week.
What this benchmark is, and what it is not
askOdin holds a reference corpus of more than 110,000 scored documents. This report uses 2,488 of them.
That is deliberate, and it is the most important methodological choice here. The reference corpus spans several engine versions, and scores produced by different versions are not comparable to one another. Pooling them would produce a bigger number and a meaningless median.
So this benchmark uses every organic deck scored by a single engine version inside a single four-week window — 21 February to 19 March 2026. Nothing from the injected benchmark corpus, which ran on a different engine and must never be averaged with organic scoring.
Twelve decks (0.5%) failed to parse and are excluded.
The distribution
| Measure | Value |
|---|---|
| Decks scored | 2,488 |
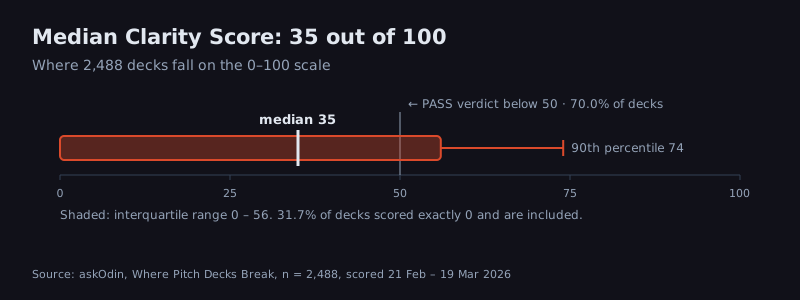
| Median | 35 / 100 |
| Mean | 33.2 |
| Interquartile range | 0 – 56 |
| 90th percentile | 74 |
| Reached 60+ | 21.3% |
| Reached 65+ | 16.5% |
| Terminal finding (kill shot) | 13.7% |
31.7% of decks scored exactly zero, and they are included in the median. Anyone recomputing without them will get a different number, so the choice is stated rather than buried. A zero is not a missing value here — it is a terminal structural finding, and excluding it would flatter the population.
It agrees with two earlier samples
This is the part that matters more than any single figure. Three independent measurements, different sizes, different windows:
| Source | n | Median | PASS-verdict rate |
|---|---|---|---|
| This benchmark | 2,488 | 35 | 70.0% |
| 134-deck study | 134 | 38 | 68% |
| Framework foundation data | — | 39 (mean) | 68% |
Medians within three points, failure rates within two. Independent samples converging is the only real evidence that an instrument measures something stable.
Where decks actually break
The Clarity Framework™ audits five immutable sections, each scored out of 20. The failure rate below is the share of decks scoring below half marks on that section — a threshold we chose, stated here so the number can be reconstructed. The ranking is stable whether or not terminal decks are included.
| Section | Below half marks | Median |
|---|---|---|
| Business Model Physics | 67.0% | 6 / 20 |
| Deal Structure | 57.8% | 8 / 20 |
| Market Evidence | 47.9% | 10 / 20 |
| Solution Logic | 24.3% | 12 / 20 |
| Problem Definition | 17.9% | 12 / 20 |
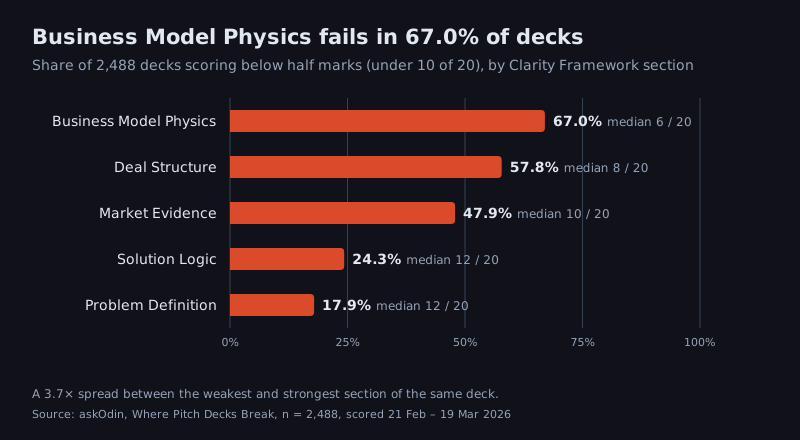
The shape is consistent and it is not what most fundraising advice assumes.
The narrative front half holds. Founders can articulate a problem and describe a solution. Those are the sections that get rehearsed, workshopped and coached, and it shows — under one in five decks fails on Problem Definition.
The economic back half collapses. Two-thirds fail on Business Model Physics: whether unit economics scale or break under load. Nearly six in ten fail on Deal Structure: whether the raise size matches what the deck claims to build.
“The problem is real, and here is the solution.”
Problem Definition fails in 17.9% of decks. Solution Logic in 24.3%. This half is coached.
“The economics scale, and the raise is sized to the plan.”
Business Model Physics fails in 67.0%. Deal Structure in 57.8%. This half is not.
A deck can clear the first two sections convincingly and still be structurally unfundable. That is precisely the deck that consumes partner time — it reads well enough to advance and fails on arithmetic nobody checked until the fourth meeting.
Stage discriminates
The compiler applies one set of floors to every deck — 50, 70 and 85 — regardless of stage. The interesting question is therefore empirical rather than definitional: do the two populations actually separate? They do.
| Stage | Median | Reached 60+ |
|---|---|---|
| Series A | 54 | 42% |
| Seed | 34 | 15.5% |
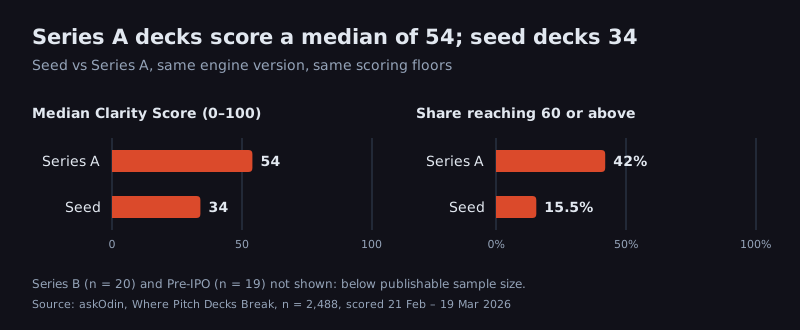
A twenty-point median gap, and Series A decks are roughly 2.7× as likely to reach 60. Whatever happens between seed and Series A — evidence accumulating, or weaker narratives being filtered out — it shows up in the score.
Two stages are excluded from this table. Series B (n = 20) and Pre-IPO (n = 19) fall below the sample size we consider publishable, and they should not be cited from this report in either direction. Every stage shown above has n ≥ 88.
Four archetypes, not seven
The Clarity Framework catalogues seven structural archetypes. Four of them fired in this dataset. Brittle Assumptions and Regulatory Grey Zone appear only in the benchmark corpus, on the other engine version, and are therefore outside the scope of this report.
That is a limitation of the window, not a finding about the taxonomy. A four-week sample of organic deal flow is not guaranteed to exercise every failure mode the framework can detect.
What this does not tell you
The Clarity Score is a verdict on reasoning, not on outcome. A high score does not predict a successful company, and a low score does not predict failure. It measures whether the case a company has built for itself survives structured scrutiny — which is a different question, and the only one an instrument like this can honestly answer.
Nothing here says two-thirds of startups have bad business models. It says two-thirds of decks fail to demonstrate that their business model holds. Those are not the same claim, and conflating them is how benchmark data usually goes wrong.
Method
- Population: every organic deck scored by a single engine version, 21 Feb – 19 Mar 2026. n = 2,488, after excluding 12 parse failures (0.5%).
- Excluded: the injected benchmark corpus in its entirety. It was scored by a different engine version, and cross-version scores are not comparable.
- Engine identification: engine version was resolved through the system-prompt table rather than the prompt-version label on the analysis row. Those two labels disagree for some eras — a naive filter on the label silently splits one engine or merges two.
- Section failure threshold: below half marks (under 10 of 20). Chosen by us, stated here, and the ranking is unchanged under alternative thresholds.
- Zeros: 31.7% of decks scored exactly 0 and are included in all central-tendency figures.
- Not published: Series B (n = 20) and Pre-IPO (n = 19), both below publishable sample size.
Founders can run their own deck against the same five pillars in Crucible, free, in under three minutes.
Related: What 134 Pitch Deck Audits Reveal · The Clarity Framework · The Methodology · The Clarity Score